Cash flow
Understand the cash flow plan
January 05, 2018

A cash flow plan is not about entering values periodically for the sake of organizing them; it is a powerful instrument once you know how to interpret those numbers.
No matter the tool (maybe it’s simply paper and pen), there are some basic things to keep in mind.
Let’s assume you have organized the cash flow into a table by months, for a time span of 12 months. You have rigorously entered all the expenses and the income, both realized and planned. Let’s see what it can tell you.
Check the current balance
Take a look at each month’s balance (Total Income – Total Expenses). How does it look? Is it negative? If it’s negative, then it means that that month you paid more money than you collected. Although on paper the general Income exceeds the costs, the imbalance may be caused by the wrong timing; it means that there are due payments preceding the cashing in, so you still need to find ways to avoid the late fees.
If the monthly balance is positive, you are safe; but don’t turn a blind eye, look further in the future. Notice the month when the balance turns negative (if it does). Calculate how much money you need to cover that difference and start thinking about ways to obtain that sum.
Check the final balance
This is an indicator of the current overall situation of the cash flow. It is a cumulative sum, which adds the previous balance to the current one. While the balance we discussed above only showed the difference resulting from money coming in and going out within a month, the cumulative balance also takes into account the money you previously had (or lacked, if negative). This result mirrors the cash flow status at a given moment since you started to track it.
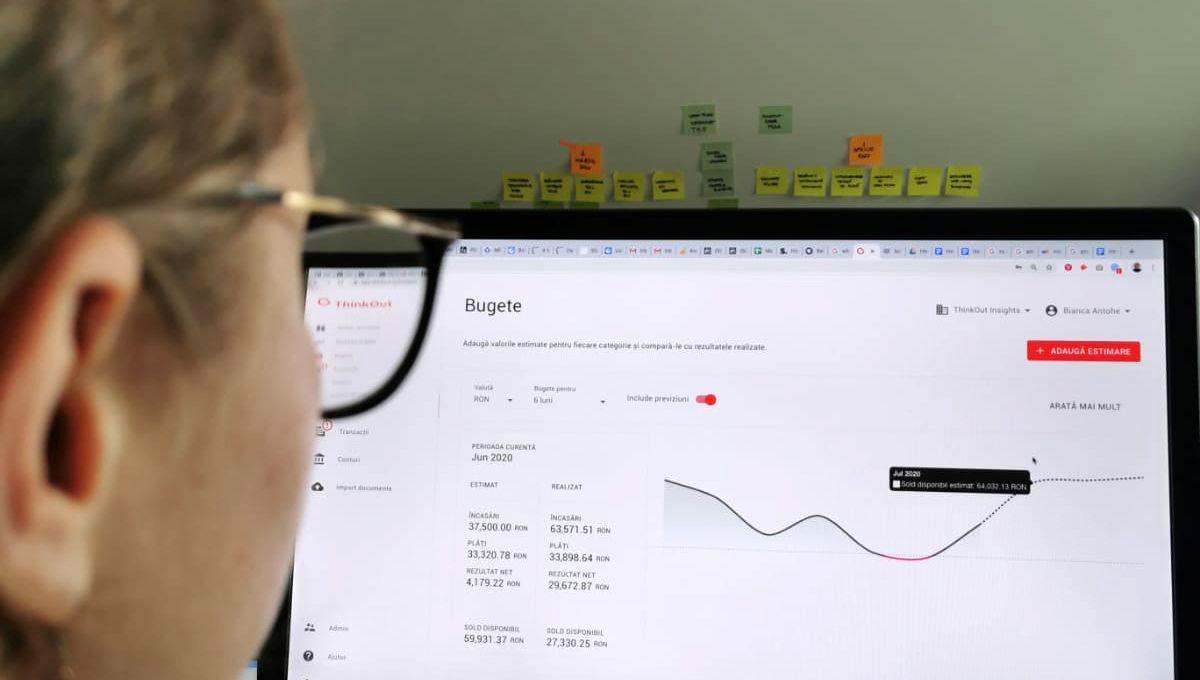
If you use ThinkOut to manage your business cash flow, there is a graphic line that helps visualize and easier understand what is going on. The Threshold line (for which you can establish any value, but let’s assume is 0) serves as a marker: when the cash flow graphic goes below – there is trouble. It is important to notice the date when this happens and the sum it lacks to get back to a positive value.
Manage your cash flow plan with ThinkOut
Start your 30-day free trial nowSome basic indicators
The Receivables indicator gives a quick idea of how much money you’re still waiting to cash; compare it to the Payables – how much you planned to spend. If Payables are greater than Receivables (which may be normal, given they reflect only planned values), start thinking how to cover or delay those upcoming costs.
Also, when using ThinkOut, you can take your analysis even more in depth and filter the transactions by labels, so you can track certain cash movements related to a specific subject or source: bank account, project, client etc. This way you’ll be able to see quickly which part of your work is inefficient (costs more than it generates revenue) or which bank account you tend to use the most and which the least.
Understanding how the money moves through your business is vital to support wise decisions. It may be as simple as closing a bank account that you only use once a year, but adds to the costs or giving up a project that costs more than it pays (unless it adds value to the brand). Numbers may be scary to some people, but if managed in an organized manner, they start “talking” clearly and offer precious information. So don’t run away from them, especially when it’s about your company’s money.
Share this article
One great read. Every month in your inbox.
Our newsletter explores new ideas for entrepreneurs to enjoy financial management and better run their businesses.
Read our blog
Learn more about cash flow management

Cash flow
How to better keep track of your company’s inflows and outflows
Want to get rid of the ever-stressful question ”Do I have enough money to pay salaries this month?” Here’s how to do that.
August 10, 2021
Read more
Cash flow
Budgeting vs Cash Flow Forecasts
Use budgets and cash flow forecasts in order to establish your business' direction.
March 18, 2021
Read more

Cash flow, Product features
How to use ThinkOut for cash flow management
Your cash flow is your company’s financial health indicator and you probably already know how important it is to carefully monitor it.
March 10, 2021
Read more